

Dendrogram: Tree of Life
You may be familiar with word Dendron (dendrites), for others to understand it is branched extension of nerve cell in the brain. It is a tree like an extensionof neural cells to body cell to transfer electrochemical information. Thus it originates from axon cell and then divides into branches called dendrites similar to a tree having different branches. This concept of branching can be taken further in order to find the evolution of dinosaurs and how human are evolved or closely related to other species(cladogram).
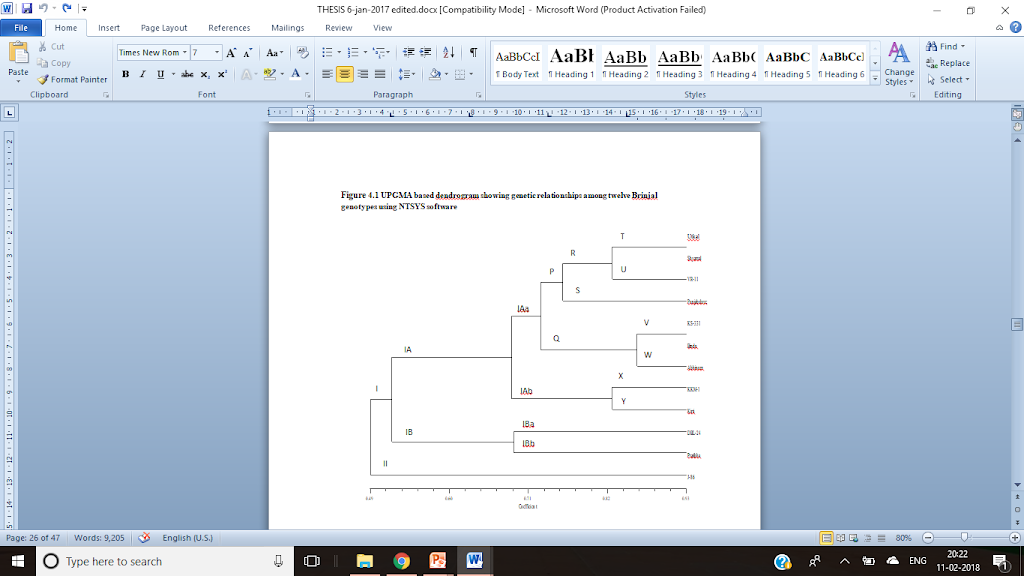
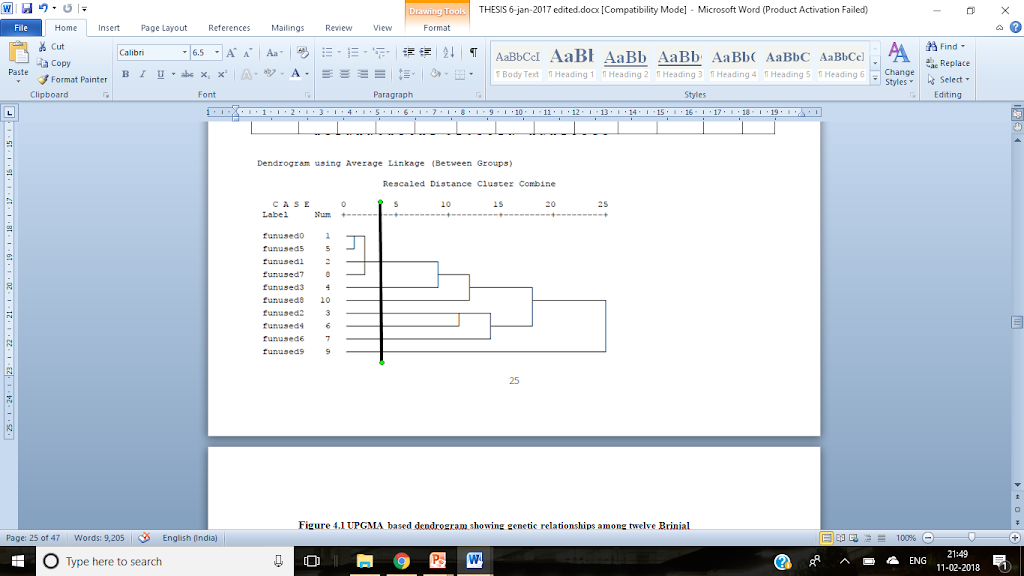
Evaluation which helps to construct a tree-like structure showing how its branches are related to each other is called dendrogram (dendron “tree” and grammar “ drawing”). In this closelyrelated species are found in the samecluster. Dendrograms helps to make hierarchical clustering of genes or sample
This type of dendrograms can be made for evolutionary analysis,genetic analysis, as well for business analysis to analyze the distance ( not only the physical distance but the distance in other attributes like satisfaction, price, product, promotion etc). So in order to find segment for particular product dendrogram can be a good visualization tool. For business analysis Statistical Package for the Social Sciences(SPSS) OR MATLAB(MATrix LABoratory) software can be used. SPSS is user-friendly i.e it works by clicking while MATLAB is analysis software for neural networking, statistic. For business analysis, the most important thing is to interpret the dendrogram
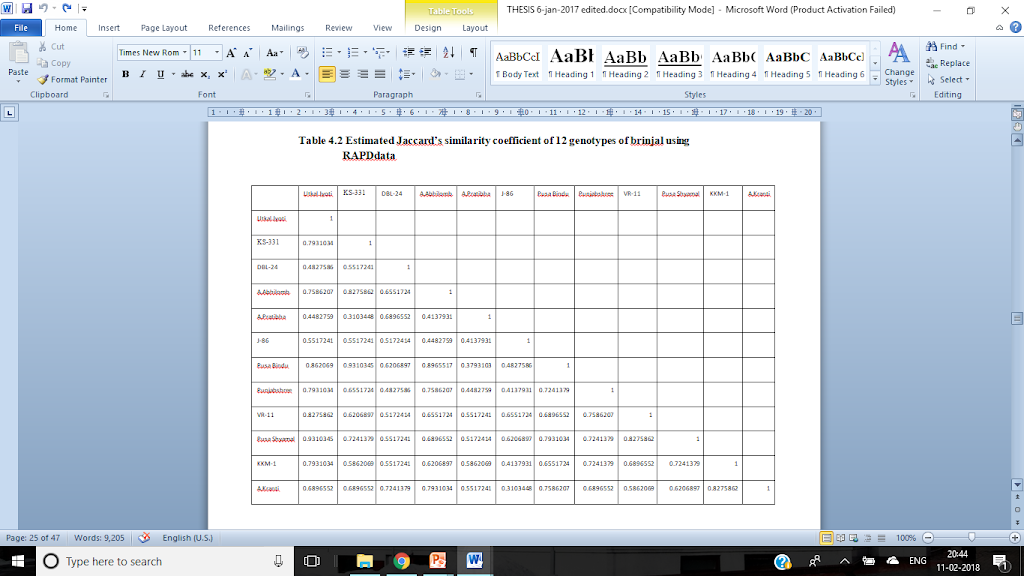
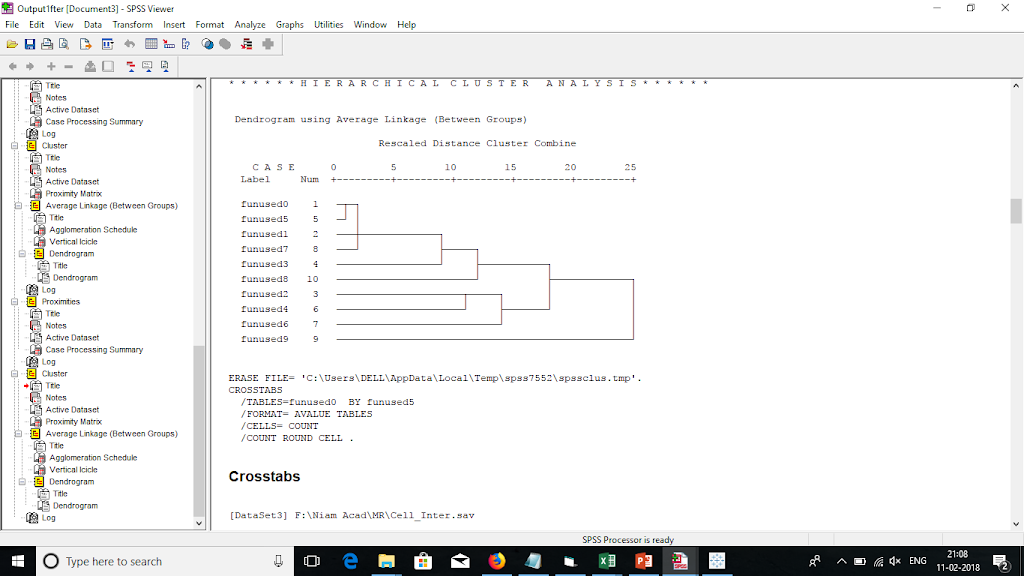
On the basis of Jaccard’s coefficient proximity matrix is formed this will give a dendrogram in SPSS and a hierarchical cluster formation can be seen. The clusteris visualized depending on the analysis we want to do as cluster analysis is exploratory approach and can be viewed. In order to find a number of the cluster a vertical line should be drawn cutting the horizontal line based on the analysis and variables we need for observation. Either agglomeration schedule should be observed or a PERMAP(perception maping) should be done to visualize the cluster. This will help to get the segment and how to target that segment. Based on this statistical analysis strategies can be formulated and advised.
By
Farooqui Ashfaque Sirajuddin


